In today's data-rich environment, selecting the right business data analysis tools is a critical strategic decision. The proper platform can transform raw, unstructured data into actionable insights that drive growth, enhance efficiency, and create a significant competitive advantage. However, the market is saturated with options, ranging from comprehensive enterprise-grade BI platforms to agile web scraping APIs designed for fresh, external data acquisition. This abundance of choice often leads to analysis paralysis, where organizations struggle to identify a solution that aligns with their specific technical needs, budget, and business objectives.
This guide is designed to cut through the noise and provide clarity. We will dissect the most powerful and popular business data analysis tools available today, moving beyond marketing claims to offer a practical assessment of their true capabilities. For each tool, you will find a detailed breakdown of its core features, ideal use cases, potential limitations, and transparent pricing information, complete with screenshots and direct links to help your evaluation. When exploring your options, you might find valuable insights in a comparison of leading data analysis tools like Power BI, Tableau, and Looker Studio to see how top-tier platforms stack up.
Furthermore, we'll demonstrate a practical, step-by-step approach to enriching your analytics pipeline. Using a tool like the Olostep API, we'll show you how to programmatically gather external web data and feed it directly into your analysis workflow. This includes complete Python requests examples, detailed error handling, and strategies for navigating anti-bot measures, ensuring you can build a robust and comprehensive data ecosystem. Our goal is to equip you with the knowledge to not only choose the best tool but to integrate it effectively for maximum impact.
1. Olostep
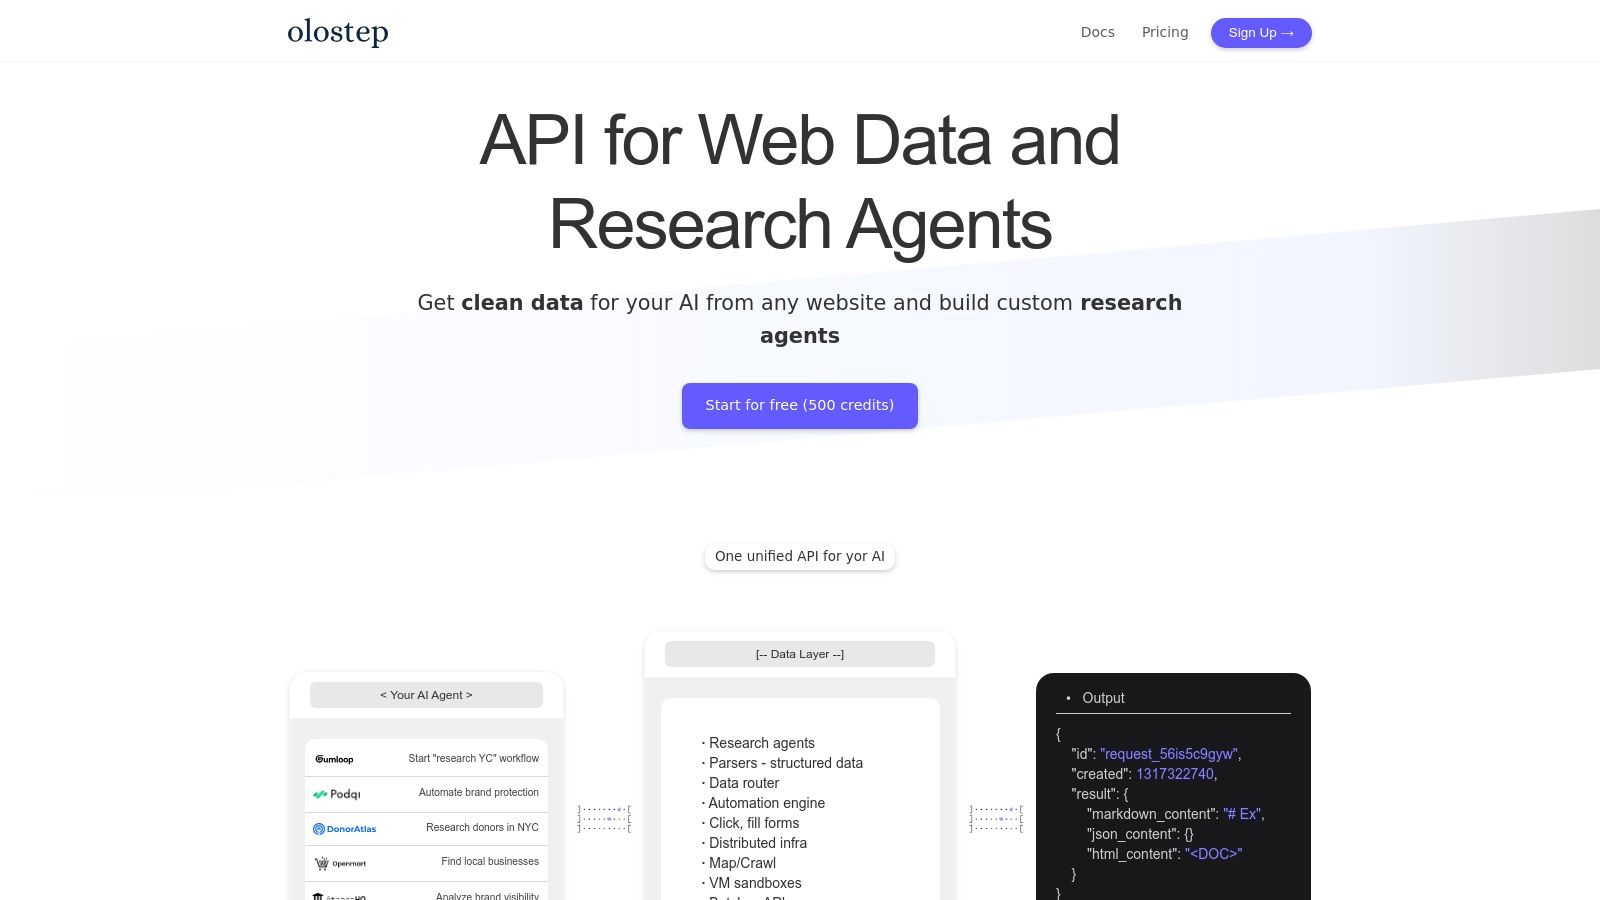
Olostep stands out as a powerful and developer-centric web scraping API, positioning itself as a foundational business data analysis tool for acquiring external data. While not a traditional BI platform, it excels at the crucial first step of any analysis workflow: data acquisition. It’s engineered for developers, data scientists, and AI startups who need to reliably extract clean, structured information from the web at a massive scale, feeding it directly into their analytical models and business intelligence systems.
Why Olostep is a Top Choice for Data Acquisition
Olostep’s primary strength lies in its robust infrastructure designed to overcome common web scraping hurdles. It seamlessly handles JavaScript-heavy websites using headless browsers and rotates through a pool of premium residential proxies to prevent blocks and CAPTCHAs. This ensures a consistent and reliable data pipeline, which is essential for time-sensitive analyses like competitor price monitoring or sentiment analysis based on real-time social media data. Its ability to process up to 100,000 simultaneous requests makes it a go-to solution for large-scale data harvesting projects, such as training LLMs or building comprehensive market intelligence databases.
Key Features & Practical Use Cases
Olostep’s feature set is tailored for automation and integration:
- High-Concurrency Scraping: Execute massive batch jobs to gather product data, user reviews, or financial reports in minutes, not hours.
- Multi-Format Output: Get data delivered as structured JSON for easy parsing, Markdown or PDF for report generation, or raw HTML for archival purposes.
- Community-Driven Parsers: Leverage pre-built, LLM-enhanced parsers for popular sites, accelerating development and reducing maintenance overhead.
Code Example: Scraping a Product Page
Here is a practical Python example demonstrating how to scrape a web page using Olostep’s API. This code sends a POST request to the /v1/scrapes endpoint to extract the HTML content, including robust error handling and retry logic.
import requests
import json
import time
import os

# Your Olostep API key
# It's recommended to store this in an environment variable for security
OLOSTEP_API_KEY = os.environ.get("OLOSTEP_API_KEY", "YOUR_API_KEY")

# API endpoint
url = "https://api.olostep.com/v1/scrapes"

# Payload for the request: scrape a sample product page
payload = {
    "url": "https://www.example.com/product/123", # Target URL to scrape
    "render_js": True, # Enable JavaScript rendering for dynamic content
    "output_format": "html" # Specify the desired output format
}

# Headers including authentication and custom user-agent
headers = {
    "x-olostep-api-key": OLOSTEP_API_KEY,
    "Content-Type": "application/json",
    "User-Agent": "MyBusinessAnalyticsBot/1.0" # A descriptive User-Agent is good practice
}

# --- Request/Response Payloads ---
# Expected Request Payload (JSON):
# {
#   "url": "https://www.example.com/product/123",
#   "render_js": true,
#   "output_format": "html"
# }
#
# Expected Successful Response Payload (JSON):
# {
#   "data": {
#     "content": "<!DOCTYPE html>...",
#     "content_type": "text/html",
#     "status_code": 200,
#     "url": "https://www.example.com/product/123"
#   },
#   "request_id": "req_abc123...",
#   "credits_used": 1
# }

# --- Error Handling & Retries ---
max_retries = 3
retry_delay = 5 # seconds

for attempt in range(max_retries):
    try:
        # Send the POST request with a timeout
        response = requests.post(url, json=payload, headers=headers, timeout=30)

        # Check for HTTP errors (4xx client error or 5xx server error)
        if 400 <= response.status_code < 600:
            print(f"Attempt {attempt + 1} failed with status code {response.status_code}.")
            print(f"Response body: {response.text}")

            # Specific handling for common errors
            if response.status_code in [429, 502, 503, 504]: # Rate limited or server error
                print(f"Retrying in {retry_delay} seconds...")
                time.sleep(retry_delay)
                continue # Go to the next attempt
            elif response.status_code == 403:
                print("Forbidden error. Check proxy settings or headers.")
                break # Don't retry on a hard 'Forbidden'
            else:
                break # Don't retry on other client errors like 400/401

        response.raise_for_status() # Raise an exception for any remaining bad status codes

        # If successful, process and print the response
        print("Scraping successful!")
        # The response is a JSON object, we'll pretty-print it
        response_data = response.json()
        print(json.dumps(response_data, indent=2))

        # Example of accessing the scraped content
        html_content = response_data.get("data", {}).get("content", "")
        print(f"\nExtracted HTML content length: {len(html_content)} characters")

        break # Exit the loop on success

    except requests.exceptions.HTTPError as errh:
        print(f"Http Error: {errh}")
        break
    except requests.exceptions.ConnectionError as errc:
        print(f"Error Connecting: {errc}")
        time.sleep(retry_delay)
    except requests.exceptions.Timeout as errt:
        print(f"Timeout Error: {errt}")
        time.sleep(retry_delay)
    except requests.exceptions.RequestException as err:
        print(f"An unexpected error occurred: {err}")
        break
else:
    print("All retries failed.")
Website: https://www.olostep.com
Pros:
- Handles massive concurrency (up to 100,000 requests simultaneously).
- Supports multiple output formats (JSON, Markdown, PDF, HTML).
- Built-in residential proxies and JS rendering bypass most anti-bot measures.
- Cost-effective pricing with a generous free tier for developers.
Cons:
- Advanced AI-powered browser automation features are currently limited to select customers.
- Higher-tier plans often require a subscription, which may not be ideal for users with sporadic, low-volume needs.
2. Microsoft Power BI
Microsoft Power BI stands as a titan in the BI space, making it one of the most indispensable business data analysis tools for organizations already embedded in the Microsoft ecosystem. It excels at transforming disparate data sources into coherent, visually immersive, and interactive insights. Its core strength lies in its seamless integration with Microsoft 365, Azure, and Excel, allowing teams to create a unified analytics environment with relative ease.
The platform empowers users to build everything from simple departmental dashboards to complex enterprise-wide reporting systems. For a data analyst, this means you can quickly connect to a SQL database or an Excel sheet, clean and model the data using Power Query, and then design compelling reports with drag-and-drop visualizations.
Key Features and Use Cases
- Self-Service Analytics: Business users can explore data and generate their own reports without heavy reliance on IT, fostering a data-driven culture.
- Deep Microsoft Integration: Embed live Power BI reports directly into SharePoint, Teams, and PowerPoint presentations for real-time decision-making during meetings.
- Advanced Data Modeling: Utilize Data Analysis Expressions (DAX) to create sophisticated calculations and measures, similar to advanced Excel formulas but far more powerful.
- Enterprise Governance: Administrators can manage access, set data sensitivity labels, and monitor usage to ensure security and compliance across the organization.
Pros and Cons
| Pros | Cons |
|---|---|
| Low Entry Cost: A free desktop version and affordable Pro licenses. | DAX Learning Curve: Advanced modeling can be challenging for beginners. |
| Vast Ecosystem: Deep integration with Azure and Microsoft 365. | License Tiers: Some key features are locked behind Premium licenses. |
| Strong Community: Extensive documentation and community support. | Performance: Reports with very large datasets can become slow. |
Pricing and Access
Power BI offers several tiers: Free for individual use, Pro ($10/user/month) for collaboration, and Premium (starting at $20/user/month or $4,995/capacity/month) for large-scale enterprise features. This flexible structure makes it accessible for startups while providing a clear path to scale. For more advanced implementations, you can explore tutorials on how to use Microsoft Power BI for sophisticated analysis.
Visit Website: https://powerbi.microsoft.com/
3. Tableau (by Salesforce)
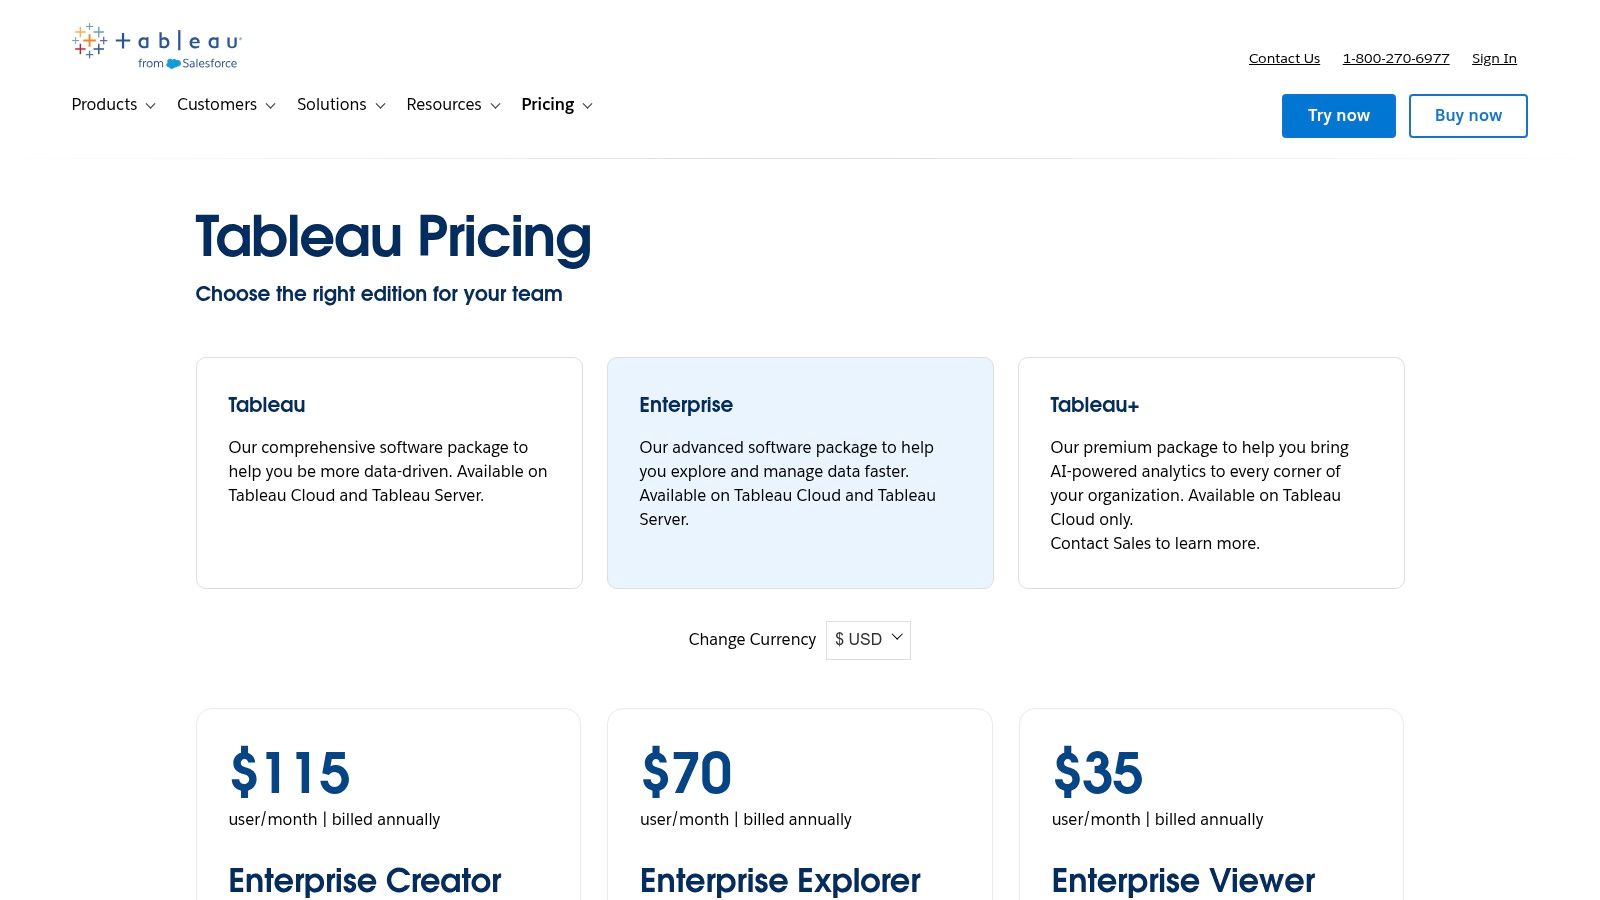
Tableau is a market leader in the visual analytics space and stands out as one of the most powerful business data analysis tools for creating beautiful, intuitive, and highly interactive visualizations. Acquired by Salesforce, it focuses heavily on data storytelling, enabling analysts to build compelling dashboards that clearly communicate insights to stakeholders at all levels, from operational teams to the C-suite. Its strength lies in its user-friendly drag-and-drop interface, which empowers users to explore data visually without writing code.
The platform is renowned for its design flexibility, allowing for the creation of pixel-perfect dashboards that are both functional and aesthetically pleasing. For analysts, this means moving beyond simple charts to craft rich, interactive experiences that invite exploration and discovery. The platform includes tools like Tableau Prep for data cleaning and Tableau Pulse for delivering proactive, AI-driven insights directly to users.
Key Features and Use Cases
- Best-in-Class Visualizations: Create stunning, interactive dashboards that are easy for business users to understand and engage with.
- Data Preparation: Use Tableau Prep Builder to visually combine, shape, and clean data from various sources before analysis.
- Proactive Insights: Tableau Pulse uses AI to automatically surface key metrics, trends, and outliers, delivering personalized insights to users.
- Flexible Deployment: Can be deployed on-premises with Tableau Server or in the cloud with the fully hosted Tableau Cloud solution.
Pros and Cons
| Pros | Cons |
|---|---|
| Intuitive Authoring: Analyst-friendly drag-and-drop interface. | Higher Cost at Scale: Can be pricier than competitors as teams grow. |
| Strong Community: Vast resources, forums, and training materials. | Tiered Licensing: Advanced features often require more expensive licenses. |
| Broad Data Connectivity: Connects to a wide range of data sources. | Resource Intensive: Complex dashboards may require significant server resources. |
Pricing and Access
Tableau's pricing is role-based, starting with Creator ($75/user/month) for analysts and designers who build content. Explorer licenses allow users to edit existing dashboards, while Viewer licenses provide read-only access. Enterprise add-ons for data management and advanced server management are available for an additional cost, making it a scalable but premium option.
Visit Website: https://www.tableau.com/pricing
4. Qlik Cloud Analytics (Qlik Sense)
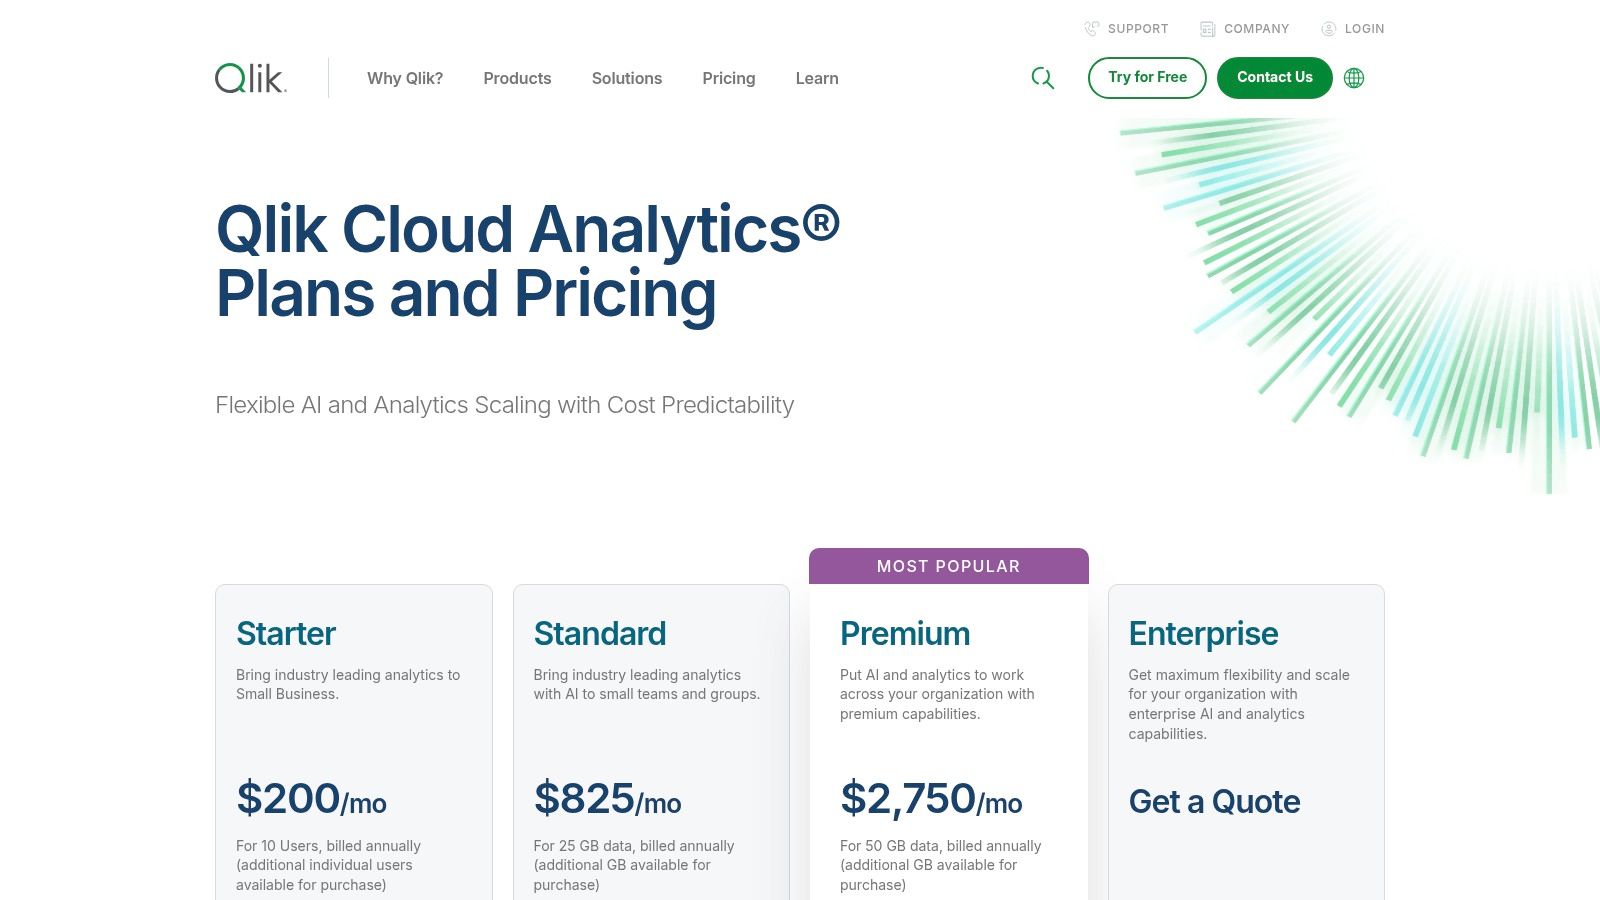
Qlik Cloud Analytics, powered by Qlik Sense, distinguishes itself with a unique associative engine that allows for free-form, exploratory analysis. Unlike query-based tools that present linear paths, Qlik encourages users to discover non-obvious relationships in their data. This makes it a powerful choice among business data analysis tools for organizations aiming to uncover hidden insights and foster genuine data curiosity.
The platform's strength is enabling users to ask questions and pivot their analysis on the fly, without needing to pre-build every query. For analysts, this means you can explore connections across multiple data sources, with the platform instantly highlighting related and unrelated values. Its AI capabilities further assist by suggesting insights and automating dashboard creation.
Key Features and Use Cases
- Associative Data Engine: Explore all possible data connections freely, rather than being limited to predefined queries. This is ideal for root cause analysis and open-ended data exploration.
- AI-Assisted Insights: Leverage AI for predictive analytics (Qlik Predict) and generative AI for natural language queries (Qlik Answers) to accelerate the discovery process.
- Embedded Analytics: Integrate fully interactive Qlik dashboards directly into operational applications, portals, and websites for in-context decision-making.
- Automation and Governance: Build automated data pipelines and analytics workflows while maintaining robust enterprise-level security and governance over data and user access.
Pros and Cons
| Pros | Cons |
|---|---|
| Excellent for Data Discovery: Uncovers non-obvious relationships. | Complex Pricing: Tier structure can be confusing for new customers. |
| Flexible Governance: Strong controls for enterprise deployments. | Learning Curve: The associative model requires a mindset shift. |
| Predictable Spend: Capacity-based model aids in budget management. | Features Tiered: Advanced AI/automation are in higher-cost plans. |
Pricing and Access
Qlik offers capacity-based pricing with three main tiers: Standard ($20/user/month), Premium ($2,700/month for 10 users & capacity), and Enterprise (custom pricing). This model is designed to provide predictable costs as usage scales, making it suitable for organizations that need to manage analytics expenses carefully while expanding their user base.
Visit Website: https://www.qlik.com/us/pricing
5. Looker (Google Cloud)
Looker, now part of the Google Cloud suite, offers a modern approach to business intelligence and analytics. It differentiates itself from other business data analysis tools by using a centralized semantic modeling layer called LookML. This allows developers and data analysts to define business metrics and logic once, ensuring that everyone in the organization is working from a single source of truth, thereby promoting data governance and consistency.
This model-driven approach makes Looker exceptionally powerful for organizations that want to embed analytics directly into their products or build custom data applications. Rather than just being a dashboarding tool, it serves as a data platform where reusable components can be built, version-controlled, and deployed with a developer-centric workflow, bridging the gap between data teams and business users.
Key Features and Use Cases
- Centralized Semantic Layer (LookML): Define all business logic and metrics in a single, version-controlled model, ensuring consistent reporting across the entire organization.
- Embedded Analytics: Robust APIs and SDKs make it easy to embed Looker visualizations, dashboards, and data exploration capabilities into external applications and websites.
- Developer-Friendly Workflows: Integrates with Git for version control, allowing teams to collaborate on data models with development, staging, and production environments.
- Modern BI & Analytics: Empowers business users with self-service tools to explore governed data, ask new questions, and create their own reports without writing SQL.
Pros and Cons
| Pros | Cons |
|---|---|
| Strong Governance: A single source of truth eliminates data silos. | Requires Modeling Discipline: Less point-and-click friendly for initial setup. |
| Developer-Friendly: Git integration and reusable models are powerful. | Opaque Pricing: Pricing is quote-based and not publicly listed. |
| Google Cloud Integration: Tight integration with BigQuery and other GCP services. | Steep Learning Curve: LookML can be complex for non-developers. |
Pricing and Access
Looker's pricing is not publicly listed and is available through a custom quote from the Google Cloud sales team. It offers various editions, including Standard, Enterprise, and Embedded, tailored to different organizational sizes and use cases. The platform is designed for businesses prioritizing data governance and scalability. For those gathering the initial data, exploring the top scraping tools can be a crucial first step before analysis.
Visit Website: https://cloud.google.com/looker/pricing
6. Amazon QuickSight (AWS)
Amazon QuickSight is a cloud-native, serverless BI service built for the AWS ecosystem, positioning it as a powerful choice among business data analysis tools for organizations heavily invested in Amazon's cloud infrastructure. It provides scalable, machine learning-powered insights without the need to manage servers. Its key differentiator is a flexible, usage-based pricing model that makes BI accessible to a wide range of users, from frequent analysts to occasional report viewers.
The platform is designed to connect seamlessly with AWS data sources like S3, Redshift, and Athena, allowing analysts to build unified dashboards directly from their data lakes and warehouses. For developers and product teams, QuickSight offers robust embedded analytics capabilities, enabling them to integrate interactive visualizations directly into their applications with minimal overhead.
Key Features and Use Cases
- Native AWS Integration: Effortlessly connect to and visualize data from AWS services, creating a streamlined analytics workflow from data storage to reporting.
- Amazon Q: Leverage generative BI capabilities to ask questions in natural language, automatically build dashboards, and generate narrative summaries of your data.
- Embedded Analytics: Integrate fully interactive dashboards into applications, websites, and portals, providing data insights directly within user workflows.
- Serverless Architecture: The platform automatically scales to handle tens of thousands of users without requiring any infrastructure provisioning or management.
Pros and Cons
| Pros | Cons |
|---|---|
| Cost-effective: Pay-per-session pricing is ideal for large user bases. | Authoring Limitations: The web-based authoring tool is less feature-rich. |
| Minimal Management: Serverless design eliminates infrastructure work. | AWS-Centric: Best suited for organizations already on AWS. |
| Highly Scalable: Scales seamlessly with your AWS data and user growth. | Learning Curve: Can be complex for those unfamiliar with AWS services. |
Pricing and Access
QuickSight offers a unique pricing model with several options. The Standard Edition starts at $9/user/month (annual billing). The Enterprise Edition introduces more advanced features, including Amazon Q, and offers pricing per Author ($24/user/month) or per Reader ($0.30/session, up to $5/month). This pay-per-session model is highly cost-effective for deploying analytics to a large, infrequent user base.
Visit Website: https://aws.amazon.com/quicksight/
7. SAP Analytics Cloud (SAC)
SAP Analytics Cloud (SAC) is a comprehensive solution that unifies business intelligence, planning, and predictive analytics into a single software-as-a-service (SaaS) platform. As one of the more specialized business data analysis tools, its greatest strength lies in its native integration with the broader SAP ecosystem, particularly for organizations running on SAP S/4HANA or using SAP Datasphere. This tight coupling allows for real-time analytics directly on operational data without complex data movement.
SAC is designed to bridge the gap between analysis and action, enabling users to move seamlessly from insight discovery to financial planning and forecasting within the same environment. For a financial analyst, this means you can analyze sales performance, then immediately adjust revenue forecasts and budget allocations in a connected planning model, all while leveraging built-in predictive capabilities to inform your decisions.
Key Features and Use Cases
- Unified Platform: Combines BI, augmented analytics, and enterprise planning in one cloud solution, eliminating data silos between analysis and financial planning teams.
- Live SAP Connectivity: Provides real-time, direct access to SAP S/4HANA, BW/4HANA, and Datasphere, ensuring decisions are based on the most current data.
- Integrated Financial Planning: Supports collaborative, end-to-end financial planning and analysis (FP&A) workflows, from budgeting and forecasting to reporting.
- Enterprise Governance: Offers robust, role-based security and administration features that integrate with existing SAP governance models to ensure data is secure and compliant.
Pros and Cons
| Pros | Cons |
|---|---|
| Seamless SAP Integration: Unmatched live connectivity to SAP sources. | Non-SAP Integration: Can require more effort to connect and model non-SAP data. |
| All-in-One FP&A: Combines analytics and planning in a single tool. | Opaque Pricing: Pricing is primarily quote-based and not publicly listed. |
| Pre-built Content: Growing library of business content for rapid deployment. | Steeper Learning Curve: Can be complex for users outside the SAP ecosystem. |
Pricing and Access
SAP Analytics Cloud pricing is primarily quote-based and tailored to specific business needs, with different editions for BI and Planning. Potential customers need to contact SAP directly for a detailed quote. While there isn't a free-forever tier, a free trial is available for evaluation.
Visit Website: https://www.sap.com/products/cloud-analytics/pricing.html
8. IBM Cognos Analytics
IBM Cognos Analytics is a heavyweight enterprise BI platform designed for organizations that require strong governance, security, and scalability. It stands out as one of the essential business data analysis tools for businesses needing flexible deployment options, offering on-premises, cloud, or containerized solutions to meet strict data residency and compliance regulations. The platform combines traditional, pixel-perfect operational reporting with modern self-service dashboards and AI-driven exploration.
This dual capability allows it to serve both IT-led enterprise reporting needs and business-led ad hoc analysis. For a business analyst, Cognos provides a robust environment for creating everything from highly formatted financial statements to interactive dashboards that uncover hidden trends, all within a single, governed ecosystem. The built-in AI assistant further democratizes data by allowing users to ask questions in natural language.
Key Features and Use Cases
- Governed Reporting: Generate highly formatted, "pixel-perfect" reports for financial statements, regulatory filings, and operational scorecards that require precise layouts.
- AI-Assisted Exploration: Use the AI Assistant to ask questions in plain English, automate data preparation, and receive predictive insights without manual modeling.
- Hybrid Deployment: Deploy on IBM Cloud, a private cloud, on-premises, or via containers, providing ultimate flexibility to meet security and infrastructure requirements.
- Self-Service Dashboards: Empower business users to create and share their own interactive dashboards and stories using a drag-and-drop interface.
Pros and Cons
| Pros | Cons |
|---|---|
| Strong Reporting Capabilities: Excels at complex, scheduled, and operational reporting. | Dated User Interface: The authoring experience can feel less intuitive than newer tools. |
| Deployment Flexibility: Hybrid options meet strict compliance and governance needs. | Opaque Pricing: Pricing is not publicly listed and requires contacting sales. |
| Enterprise-Grade Security: Robust governance features for large organizations. | Steeper Learning Curve: Can be more complex to master compared to competitors. |
Pricing and Access
IBM Cognos Analytics pricing is quote-based and tailored to specific deployment needs, whether on-cloud or on-premises. A 30-day free trial is available for the cloud version, allowing teams to explore its capabilities without commitment. This model is best suited for large enterprises that require a customized solution and dedicated support.
Visit Website: https://www.ibm.com/products/cognos-analytics
9. Domo
Domo positions itself as a cloud-native data experience platform, offering a comprehensive, end-to-end solution in a single SaaS package. It is designed to be one of the most integrated business data analysis tools, combining data connection, ETL (extract, transform, load), visualization, and even custom app-building capabilities. Its primary strength is its fast time-to-value, empowering business users to move from raw data to actionable insights quickly without juggling multiple disparate systems.
The platform is built to handle the entire data lifecycle, from ingestion using its vast library of connectors to building interactive dashboards and alerts. For an analyst, this means you can connect to a marketing platform like Marketo, blend its data with sales figures from a CRM, and visualize the entire customer journey in one place, all within Domo's ecosystem.
Key Features and Use Cases
- End-to-End Stack: Offers a unified environment for data ingestion, transformation (ETL), visualization, and reporting, reducing the need for multiple tools.
- App Studio: Enables developers to build and embed custom data applications, providing tailored analytical experiences directly within business workflows.
- Strong Governance: Features a built-in data catalog and lineage tracking, giving administrators clear visibility into data usage and ensuring compliance.
- Business User Enablement: Its intuitive interface and pre-built components are designed for non-technical users to self-serve their data needs.
Pros and Cons
| Pros | Cons |
|---|---|
| Fast Time-to-Value: All-in-one platform accelerates deployment. | Complex Pricing: Consumption model can be hard to predict and monitor. |
| Unlimited Users: Pricing supports unlimited users, fostering wide adoption. | Unexpected Overages: Users may face surprise costs without careful credit management. |
| Turnkey Solution: Ideal for teams wanting a ready-to-use analytics solution. | Steeper for Simple Tasks: Can be overkill for basic dashboarding needs. |
Pricing and Access
Domo operates on a consumption-based pricing model, where costs are tied to credits used for data queries, storage, and other activities. This model can be cost-effective for organizations with varying usage patterns but requires careful monitoring to manage expenses. A 30-day free trial is available for teams to evaluate the platform's full capabilities.
Visit Website: https://www.domo.com/pricing
10. Zoho Analytics
Zoho Analytics has carved out a significant niche among business data analysis tools by offering a powerful, accessible, and highly affordable BI solution. It is particularly well-suited for small to mid-sized businesses (SMBs) that need comprehensive analytics without the enterprise-level cost or complexity. Its major advantage is its seamless integration into the broader Zoho ecosystem, including Zoho CRM and Books, creating a unified data environment for businesses running on their software suite.
The platform is designed for ease of use, enabling business users to connect to over 500 data sources and create insightful reports and dashboards with a simple drag-and-drop interface. For analysts, this means less time spent on data wrangling and more time uncovering trends. The AI assistant, "Ask Zia," further democratizes data analysis by allowing users to ask questions in natural language and receive instant visualizations and narrative insights.
Key Features and Use Cases
- AI-Powered Analytics: Use "Ask Zia" to generate reports via natural language queries, identify trends, and get automated insights without writing complex code.
- Broad Data Connectivity: Connect to hundreds of popular business applications, cloud drives, and databases with pre-built connectors that simplify data ingestion.
- Embedded Analytics and Portals: Embed live reports and dashboards into your applications, websites, or portals to provide analytics directly to clients or internal teams.
- Collaborative BI: Share reports securely with fine-grained permissions, add comments, and schedule report delivery to keep stakeholders informed.
Pros and Cons
| Pros | Cons |
|---|---|
| Exceptional Affordability: Very competitive pricing, including a free plan. | Scaling Limitations: Row and user limits on lower tiers can be restrictive. |
| User-Friendly Interface: Intuitive drag-and-drop report builder. | Less Advanced Governance: Lacks the deep semantic modeling of enterprise tools. |
| Strong Zoho Ecosystem Integration: Works flawlessly with other Zoho apps. | AI Can Be Inconsistent: "Ask Zia" may struggle with very complex queries. |
Pricing and Access
Zoho Analytics offers a flexible pricing model: a Free plan for up to 2 users, a Basic plan starting at $24/month for 2 users and 0.5 million rows, and progressively larger plans for growing teams. This structure makes it an excellent entry point for startups. You can even use its data to inform other business processes, such as learning how to build a website chatbot powered by customer insights.
Visit Website: https://www.zoho.com/analytics/
11. Sigma Computing
Sigma Computing offers a unique approach to analytics by bringing the power of a modern cloud data warehouse directly into a familiar spreadsheet interface. It is one of the most innovative business data analysis tools for teams that live in spreadsheets but need to analyze massive, live datasets without writing SQL. Sigma sits directly on top of platforms like Snowflake, BigQuery, and Redshift, allowing users to explore billions of rows of data in real time.
This "warehouse-native" model eliminates data extracts, latency, and the governance issues associated with moving data into separate BI systems. For a finance or operations analyst, this means they can use their existing spreadsheet skills to perform complex analysis, build dashboards, and collaborate on live data without ever leaving the governed environment of their data warehouse.
Key Features and Use Cases
- Live Spreadsheet Interface: Users interact with warehouse data through a powerful, intuitive spreadsheet UI, complete with formulas, pivot tables, and charts.
- No-Code Analytics: Empowers business users to conduct sophisticated analysis, join data, and build interactive dashboards without writing a single line of SQL.
- Centralized Governance: All queries run directly on the cloud warehouse, inheriting its security, governance, and performance, ensuring a single source of truth.
- Embedded Analytics: Build and embed live data applications and dashboards into other business systems, providing insights directly within user workflows.
Pros and Cons
| Pros | Cons |
|---|---|
| Minimal Learning Curve: Ideal for Excel and Google Sheets power users. | Requires Cloud Data Warehouse: Best suited for modern data stacks. |
| Scalability: Leverages the full power of the underlying data warehouse. | Quote-Based Pricing: No public pricing tiers are available on their website. |
| Collaboration: Real-time collaboration, versioning, and commenting. | Niche Focus: Less feature-rich for traditional on-premise data sources. |
Pricing and Access
Sigma Computing's pricing is not publicly listed and requires contacting their sales team for a custom quote. This sales-led model is typical for enterprise-grade platforms tailored to specific organizational needs based on warehouse size, user count, and feature requirements. A free trial is available to test the platform's capabilities with your own data warehouse.
Visit Website: https://www.sigmacomputing.com/
12. AWS Marketplace (Business Intelligence category)
For organizations deeply integrated into the AWS ecosystem, the AWS Marketplace serves as a strategic procurement hub rather than just another vendor list. It simplifies the discovery, purchase, and deployment of third-party business data analysis tools directly within the AWS environment. This model streamlines vendor management and consolidates billing, allowing companies to leverage their existing AWS commitments and governance frameworks for new software acquisitions.
Instead of navigating complex individual contracts, a data analytics leader can use the marketplace to procure tools like Tableau or Qlik through private offers. This approach centralizes control, simplifies compliance, and ensures that all analytics software adheres to the organization's financial operations (FinOps) and security policies from day one.
Key Features and Use Cases
- Centralized Procurement: Discover and buy a wide range of BI and analytics software, from visualization platforms to data governance tools, using a single, unified process.
- Consolidated Billing: All software purchases are added to your existing AWS bill, simplifying accounting and making it easier to track analytics-related spending.
- Private Offers and Enterprise Contracts: Negotiate custom pricing, terms, and end-user license agreements directly with software vendors for enterprise-scale deployments.
- One-Click Deployment: Many offerings can be deployed quickly and seamlessly into your AWS account, reducing the technical overhead for implementation.
Pros and Cons
| Pros | Cons |
|---|---|
| Simplified Vendor Management: Consolidates contracts and billing into one platform. | AWS-Centric: Provides the most value to organizations already using AWS. |
| Streamlined Compliance: Leverages existing AWS governance and security controls. | Varying Listing Quality: The detail and transparency of listings can differ. |
| Cost Efficiency: Utilizes existing AWS spend commitments for software purchases. | Requires Due Diligence: Users must still vet each tool for their specific needs. |
Pricing and Access
Pricing is determined by the individual software vendors listing their products on the marketplace. Costs can range from free trials and hourly rates to annual subscriptions and multi-year enterprise contracts. Access is available to any organization with an AWS account, making it a highly accessible channel for acquiring and managing business data analysis tools.
Visit Website: https://aws.amazon.com/marketplace/
Core Features Comparison of 12 Business Data Analysis Tools
| Product | Core Features / Capabilities | User Experience / Quality ★ | Value & Pricing 💰 | Target Audience 👥 | Unique Selling Points ✨ |
|---|---|---|---|---|---|
| Olostep 🏆 | Scalable API, JS rendering, multi-format output | ★★★★★ Fast, reliable, high concurrency | Free tier (500 credits), cost-effective, scalable | Developers, AI startups, data scientists 👥 | Premium proxies, LLM-based custom parsers, community-driven |
| Microsoft Power BI | Rich visuals, MS365 & Azure integration | ★★★★ Moderate learning curve | Affordable entry, premium tiers | Enterprises using Microsoft stack 👥 | Strong governance, broad community |
| Tableau (Salesforce) | Interactive visualizations, data prep tools | ★★★★ Analyst-friendly | Mid to high pricing | Analysts, executives 👥 | Best-in-class visuals, flexible dashboards |
| Qlik Cloud Analytics | Associative engine, AI insights | ★★★★ Exploratory data focus | Capacity-based, complex tiers | Enterprises with data exploration needs 👥 | AI-assisted predictive & generative insights |
| Looker (Google Cloud) | Semantic modeling (LookML), strong governance | ★★★★ Developer-oriented | Quote-based pricing | Enterprises prioritizing governance 👥 | Embeddable analytics, Google Cloud integration |
| Amazon QuickSight (AWS) | Serverless BI, AWS integration, conversational AI | ★★★ Good scalability | Pay-per-session & capacity pricing | AWS-centric orgs, casual viewers 👥 | Amazon Q natural language analytics |
| SAP Analytics Cloud | BI + planning + predictive, SAP integration | ★★★ Enterprise-focused | Quote-based (no public pricing) | SAP environments 👥 | End-to-end FP&A, tightly SAP-integrated |
| IBM Cognos Analytics | Governed reporting, AI insights, hybrid deploy | ★★★ Enterprise-grade | Not fully transparent | Large enterprises, regulated sectors 👥 | Deployment flexibility, pixel-perfect reports |
| Domo | End-to-end data stack, app studio | ★★★ Fast to implement | Consumption/credit pricing | Business users needing turnkey BI 👥 | App building, unlimited users flexible pricing |
| Zoho Analytics | Drag-and-drop, AI assistant, 500+ connectors | ★★★ Easy setup | Competitive, free & clear tiers | SMBs, teams needing affordable BI 👥 | Strong collaboration, simple pricing |
| Sigma Computing | Spreadsheet UI, live cloud warehouse querying | ★★★ Excel-like, minimal learning | Quote-based, sales-led | Finance & ops teams with cloud data 👥 | Warehouse-native, no data extracts needed |
| AWS Marketplace (BI) | Centralized procurement, private offers | ★★★ Basic platform | Consolidated billing, negotiated terms | AWS users & procurement teams 👥 | Simplified vendor mgmt, AWS integration |
Putting It All Together: Your Next Steps
Navigating the expansive landscape of business data analysis tools can feel overwhelming. We've explored a dozen powerful platforms, from the visual storytelling prowess of Tableau and the enterprise-grade integration of Microsoft Power BI to the cloud-native agility of Looker and Amazon QuickSight. We also delved into specialized solutions like Olostep, which addresses the critical, often-overlooked first step: acquiring clean, structured, and timely external data. The central takeaway is that there is no single "best" tool; there is only the best tool for your unique business context, technical maturity, and strategic goals.
Your journey doesn't end with reading this list. It begins with a strategic evaluation of your organization's specific needs. The right tool will act as a force multiplier, transforming raw data into a strategic asset that drives smarter decisions, uncovers hidden opportunities, and provides a clear competitive edge. Conversely, the wrong tool can lead to frustrated teams, wasted resources, and a data infrastructure that creates more problems than it solves.
A Checklist for Choosing Your Data Analysis Tool
To move from evaluation to implementation, use the following checklist to systematically vet your top contenders. This framework encourages you to think beyond features and consider the holistic impact of a new tool on your operations.
1. Define Your Core Use Case:
- What problem are you solving? Are you building executive dashboards (Power BI, Tableau), enabling self-service analytics for business users (Qlik, Zoho Analytics), or integrating real-time external data for competitive analysis (Olostep)? Be specific.
- Who are the end-users? Will data scientists, business analysts, or C-suite executives be the primary users? The required technical skill level varies drastically between tools like Sigma Computing (SQL-friendly) and Domo (user-friendly).
- What are your data sources? List every data source you need to connect to, from internal SQL databases and cloud warehouses like Snowflake to external APIs and public websites. Ensure your chosen tool has robust, pre-built connectors for your key sources.
2. Assess Technical and Operational Fit:
- What is your existing tech stack? If your organization is heavily invested in the Microsoft Azure ecosystem, Power BI offers seamless integration. Similarly, an AWS-centric company will find Amazon QuickSight a natural fit.
- What is your team's skillset? Do you have a team of SQL experts who can leverage the power of Looker's LookML, or do you need a low-code/no-code, drag-and-drop interface?
- How will you manage deployment and maintenance? Do you prefer a fully managed cloud solution like SAP Analytics Cloud, or do you have the IT resources to manage an on-premise or private cloud deployment?
3. Evaluate Scalability and Total Cost of Ownership (TCO):
- What is your budget? Consider not just the upfront licensing fees but also the costs of implementation, training, and ongoing maintenance. Pricing models can range from per-user/per-month to consumption-based (e.g., Amazon QuickSight sessions).
- How will the tool scale? Can it handle your projected data volume and user growth over the next three to five years? Look for a tool that can grow with you without requiring a complete overhaul.
- Does the vendor offer adequate support? Review the vendor's support plans, community forums, and documentation. Strong support is critical, especially during the initial implementation phase.
By methodically working through this checklist, you can move beyond marketing claims and select one of the business data analysis tools that genuinely aligns with your strategic vision. The final step is to run a proof-of-concept (POC) with your top one or two choices. There is no substitute for hands-on experience. Use a real-world dataset and a defined business problem to see how the tool performs under pressure, empowering your team to make a confident, data-backed decision.
Ready to fuel your analytics with high-quality, real-time external data? Many of the powerful business data analysis tools discussed here truly shine when fed with fresh market, competitor, and customer data. Olostep provides a robust, developer-first API to scrape and structure web data at scale, ensuring your dashboards and models are always built on the most current information.